Grafana Dashboards
Audience: SRE, Platform engineer
Part of the Observability guide. The panels below query the Metrics reference and the SLO recording rules; the scrape wiring they depend on is in Accessing metrics.
Import as code. Two reference dashboards ship under
deploy/monitoring/— import them into Grafana (Dashboards → New → Import) or provision them, rather than rebuilding the panels by hand. They split along the scrape boundary each reads from; the layouts below document what each contains.
| Dashboard | Source scrape | Audience |
|---|---|---|
grafana-dashboard-tenant.json |
a tenant's AGC + egress proxy (per-tenant mTLS) | operator of one tenant's runners |
grafana-dashboard-platform.json |
the GMC manager (one cluster-wide TLS scrape) | SRE running the GMC / the fleet |
The split mirrors how the metrics are exposed (see Accessing metrics): a platform operator scrapes the single GMC endpoint and cannot necessarily reach every tenant's mTLS metrics port, so the fleet rollups the GMC exports (managed_gateways, runnergroups_degraded, egress_rules_stale, the proxy-quota gauges) get their own dashboard.
The screenshots below are rendered against a real Prometheus with synthetic data by the reproducible harness in
deploy/monitoring/preview/; regenerate them there whenever a dashboard changes.
Tenant dashboard
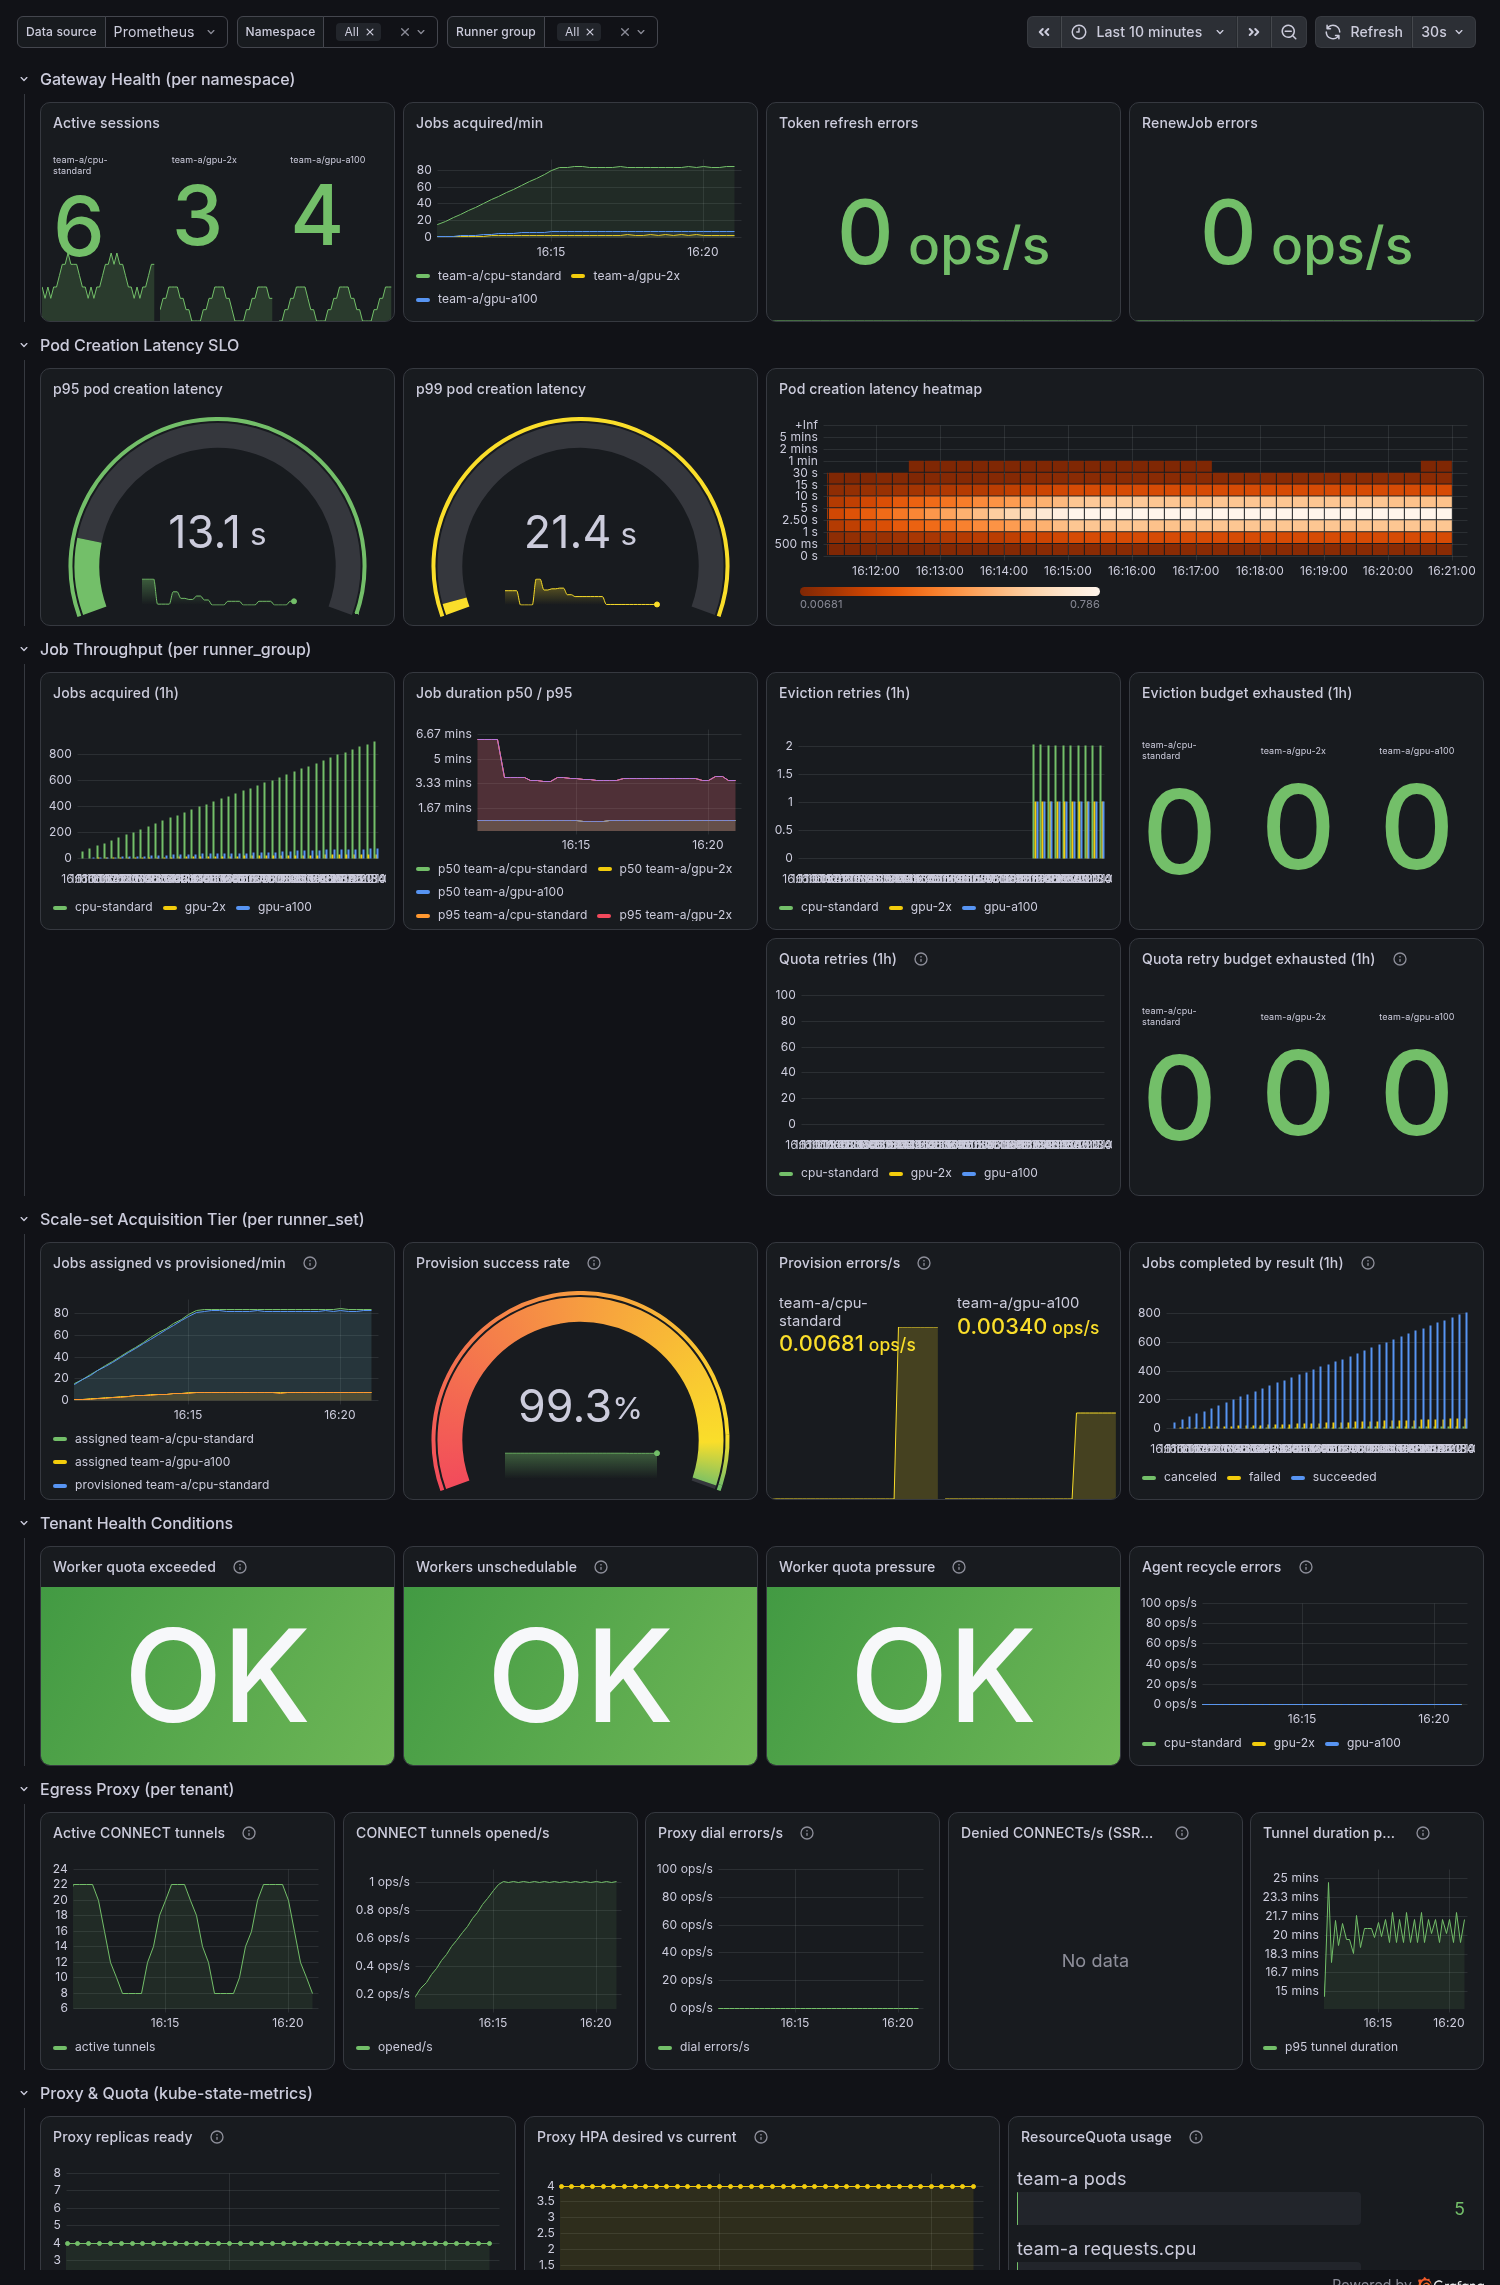
Filtered by the $namespace and $runner_group template variables. Uses the SLO recording rules as data sources where applicable.
Row 1 — Gateway Health (per namespace)
| Panel | Query | Visualization |
|---|---|---|
| Active sessions | actions_gateway_active_sessions |
Stat / Time series |
| Jobs acquired/min | rate(actions_gateway_jobs_acquired_total[5m]) * 60 |
Time series |
| Token refresh errors | rate(actions_gateway_token_refresh_errors_total[5m]) |
Stat (threshold: >0 = red) |
| RenewJob errors | rate(actions_gateway_renew_job_errors_total[5m]) |
Stat (threshold: >0 = yellow) |
Row 2 — Pod Creation Latency SLO
| Panel | Query | Visualization |
|---|---|---|
| p95 latency | actions_gateway:pod_creation_latency_seconds:p95 |
Gauge (green <15s, yellow <60s, red >60s) |
| p99 latency | actions_gateway:pod_creation_latency_seconds:p99 |
Gauge |
| Latency heatmap | rate(actions_gateway_pod_creation_latency_seconds_bucket[5m]) |
Heatmap |
Row 3 — Job Throughput (per runner_group)
| Panel | Query | Visualization |
|---|---|---|
| Jobs acquired total | increase(actions_gateway_jobs_acquired_total[1h]) |
Bar chart by runner_group |
| Job duration p50/p95 | actions_gateway:job_duration_seconds:p50/p95 |
Time series |
| Eviction retries | increase(actions_gateway_eviction_retries_total[1h]) |
Bar chart |
| Eviction budget exhausted | increase(actions_gateway_eviction_retries_exhausted_total[1h]) |
Stat (threshold: >0 = red) |
| Quota retries | increase(actions_gateway_quota_retries_total[1h]) |
Bar chart |
| Quota retry budget exhausted | increase(actions_gateway_quota_retries_exhausted_total[1h]) |
Stat (threshold: >0 = red) |
Row 4 — Scale-set Acquisition Tier (per runner_set)
The default acquisition protocol (Q264). These panels are the scale-set analog of the classic Gateway-Health and Job-Throughput rows above: a ScaleSet-protocol RunnerSet never emits actions_gateway_active_sessions or jobs_acquired_total, so its throughput and health are only visible here. Labelled by runner_set (not runner_group), so the $runner_group variable does not filter these.
| Panel | Query | Visualization |
|---|---|---|
| Jobs assigned vs. provisioned/min | sum by (namespace, runner_set) (rate(actions_gateway_scaleset_jobs_assigned_total[5m])) * 60 and the …_provisioned_total counterpart |
Time series (a persistent gap = provisioning lagging) |
| Provision success rate | actions_gateway:scaleset_provision_success_rate:rate5m |
Gauge (green >0.99, yellow <0.99, red <0.9) |
| Provision errors/s | sum by (namespace, runner_set) (rate(actions_gateway_scaleset_provision_errors_total[5m])) |
Stat (threshold: >0 = yellow) |
| Jobs completed by result (1h) | sum by (result) (increase(actions_gateway_scaleset_jobs_completed_total[1h])) |
Bar chart by result |
Row 5 — Tenant Health Conditions
| Panel | Query | Visualization |
|---|---|---|
| Worker quota exceeded | max(actions_gateway_worker_quota_exceeded) |
Stat (1 = red) |
| Workers unschedulable | max(actions_gateway_workers_unschedulable) |
Stat (1 = red) |
| Worker quota pressure | max(actions_gateway_worker_quota_pressure) |
Stat (1 = yellow) |
| Agent recycle errors | rate(actions_gateway_agent_recycle_errors_total[5m]) |
Time series |
Row 6 — Egress Proxy (per tenant)
| Panel | Query | Visualization |
|---|---|---|
| Active CONNECT tunnels | actions_gateway_proxy_connections_active |
Time series |
| CONNECT tunnels opened/s | rate(actions_gateway_proxy_connections_total[5m]) |
Time series |
| Proxy dial errors/s | rate(actions_gateway_proxy_dial_errors_total[5m]) |
Time series |
| Denied CONNECTs/s (SSRF signal) | rate(actions_gateway_proxy_connect_denied_total[5m]) |
Time series |
| Tunnel duration p95 | histogram_quantile(0.95, rate(actions_gateway_proxy_tunnel_duration_seconds_bucket[5m])) |
Time series |
Row 7 — Proxy & Quota (kube-state-metrics)
| Panel | Query | Visualization |
|---|---|---|
| Proxy replicas ready | kube_deployment_status_replicas_ready{deployment="actions-gateway-proxy"} |
Time series |
| HPA desired vs. current | kube_horizontalpodautoscaler_status_*_replicas |
Time series |
| ResourceQuota usage | kube_resourcequota{type="used"} filtered by namespace |
Bar gauge |
Row 7 — Reliability Signals (Q315)
| Panel | Query | Visualization |
|---|---|---|
| Job acquisition errors/s (by reason) | sum by (namespace, reason) (rate(actions_gateway_job_acquisition_errors_total[5m])) |
Time series |
| Message poll errors/s (by reason) | sum by (namespace, reason) (rate(actions_gateway_message_poll_errors_total[5m])) |
Time series |
| RenewJob teardowns/s (by reason) | sum by (namespace, reason) (rate(actions_gateway_renew_job_teardowns_total[5m])) |
Time series |
| Worker pods reaped/s (by reason) | sum by (runner_group, reason) (rate(actions_gateway_worker_pods_reaped_total[5m])) |
Time series |
| Broker token propagation retries/s | sum by (runner_group) (rate(actions_gateway_broker_token_propagation_retries_total[5m])) |
Time series |
Row 8 — Fan-out Safety (Q260 / Q266)
| Panel | Query | Visualization |
|---|---|---|
| Duplicate job deliveries/s | sum by (runner_group) (rate(actions_gateway_jobs_duplicate_delivery_total[5m])) |
Time series |
| Abandoned-delivery completions/s (by outcome) | sum by (runner_group, outcome) (rate(actions_gateway_abandoned_delivery_completions_total[5m])) |
Time series |
| Fan-out loser recycle deferred/s (by outcome) | sum by (runner_group, outcome) (rate(actions_gateway_fanout_loser_recycle_deferred_total[5m])) |
Time series |
Platform dashboard
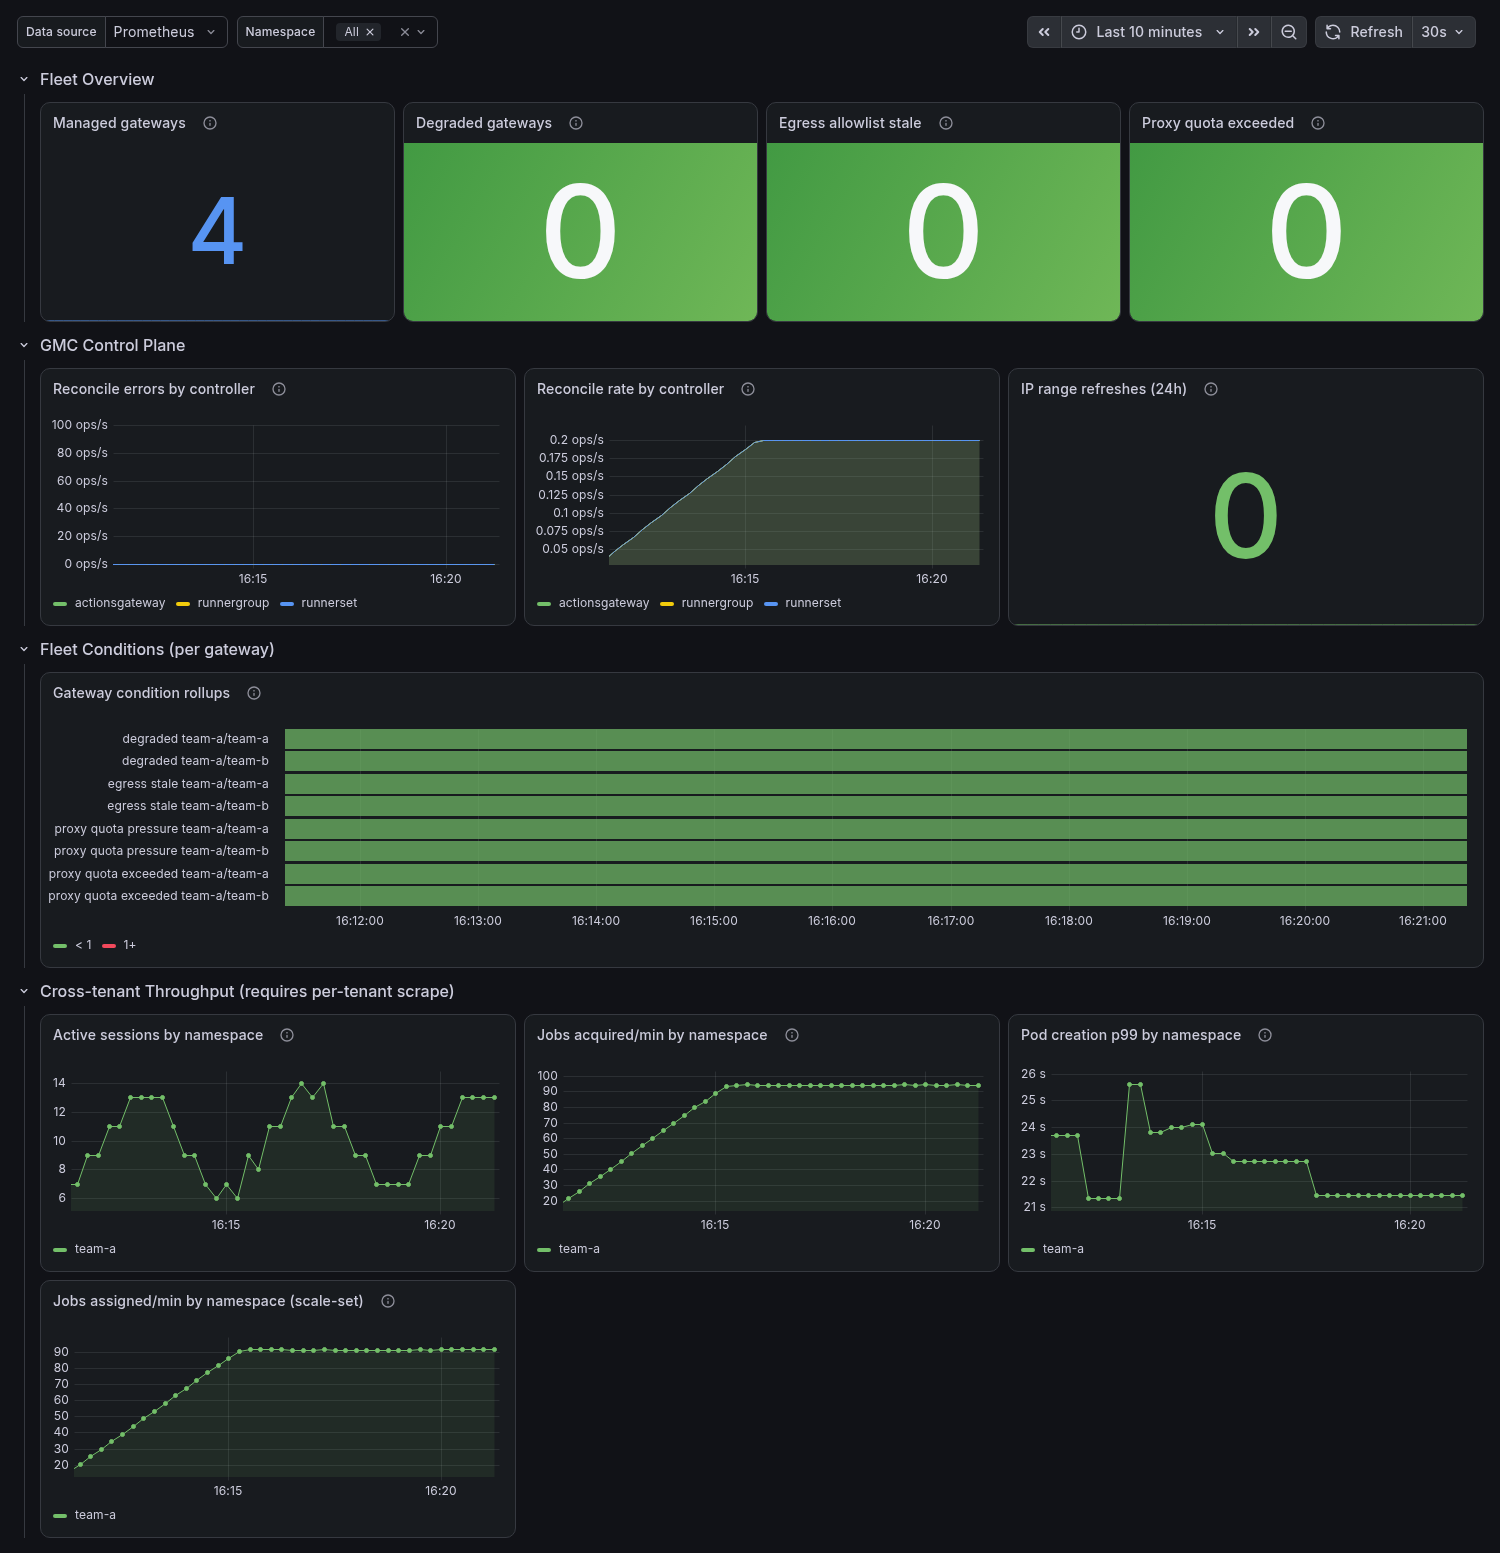
Fleet-wide; $namespace filters the cross-tenant rows.
Row 1 — Fleet Overview
| Panel | Query | Visualization |
|---|---|---|
| Managed gateways | actions_gateway_managed_gateways |
Stat |
| Degraded gateways | sum(actions_gateway_runnergroups_degraded) (v1) / sum(actions_gateway_runnersets_degraded) (v2) |
Stat (>0 = red) |
| Egress allowlist stale | sum(actions_gateway_egress_rules_stale) |
Stat (>0 = red) |
| Proxy quota exceeded | sum(actions_gateway_proxy_quota_exceeded) |
Stat (>0 = red) |
Row 2 — GMC Control Plane
| Panel | Query | Visualization |
|---|---|---|
| Reconcile errors by controller | rate(controller_runtime_reconcile_errors_total[5m]) |
Time series |
| Reconcile rate by controller | rate(controller_runtime_reconcile_total[5m]) |
Time series |
| IP range refreshes (24h) | sum(increase(actions_gateway_ip_range_updates_total[24h])) |
Stat |
Row 3 — Fleet Conditions (per gateway)
| Panel | Query | Visualization |
|---|---|---|
| Gateway condition rollups | actions_gateway_runnergroups_degraded / _egress_rules_stale / _proxy_quota_pressure / _proxy_quota_exceeded (v1); _runnersets_degraded / _agc_available / _egress_unattributed (v2) |
State timeline (1 = firing) |
Row 4 — Cross-tenant Throughput (requires the per-tenant AGC scrapes)
| Panel | Query | Visualization |
|---|---|---|
| Active sessions by namespace | sum by (namespace) (actions_gateway_active_sessions) |
Time series |
| Jobs acquired/min by namespace (classic) | sum by (namespace) (rate(actions_gateway_jobs_acquired_total[5m])) * 60 |
Time series |
| Jobs assigned/min by namespace (scale-set) | sum by (namespace) (rate(actions_gateway_scaleset_jobs_assigned_total[5m])) * 60 |
Time series |
| Pod creation p99 by namespace | actions_gateway:pod_creation_latency_seconds:p99 |
Time series |
Dashboard Variables
The dashboards ship with these template variables already wired:
$namespace—label_values({__name__=~"actions_gateway_active_sessions|actions_gateway_scaleset_jobs_assigned_total"}, namespace)— filters to a single tenant (both dashboards). The union of the classic and scale-set series is deliberate: a scale-set-only deploy emits noactive_sessions, so keying the variable on that alone would leave the dashboard blank.$runner_group—label_values(actions_gateway_active_sessions{namespace="$namespace"}, runner_group)— filters to a specific RunnerGroup on the classic-tier panels (tenant dashboard). The scale-set panels are labelledrunner_setand are not filtered by it.
← Back to Observability