Grafana Dashboards¶
Audience: Platform engineer, Tenant operator, Budget owner, Security
Part of the Observability guide. The panels below query the Metrics reference and the SLO recording rules; the scrape wiring they depend on is in Accessing metrics.
Import as code. Four reference dashboards ship under
deploy/monitoring/: import them into Grafana (Dashboards → New → Import) or provision them, rather than rebuilding the panels by hand. The layouts below document what each contains.
| Dashboard | Source scrape | Audience |
|---|---|---|
grafana-dashboard-tenant.json |
a tenant's AGC + egress proxy (per-tenant mTLS) | operator of one tenant's runners |
grafana-dashboard-platform.json |
the GMC manager (one cluster-wide TLS scrape) | Platform engineer running the GMC / the fleet |
grafana-dashboard-budget.json |
a tenant's AGC (per-tenant mTLS) | Budget owner paying for the fleet |
grafana-dashboard-security.json |
the per-tenant proxy and AGC scrapes, the GMC scrape, and the apiserver scrape | Security / compliance reviewer asking for evidence |
The first two split along the scrape boundary each reads from, which mirrors how the metrics are exposed (see Accessing metrics): a platform operator scrapes the single GMC endpoint and cannot necessarily reach every tenant's mTLS metrics port, so the fleet rollups the GMC exports (managed_gateways, runnergroups_degraded, egress_rules_stale, the proxy-quota gauges) get their own dashboard.
The budget dashboard splits on a different axis: it reads the same tenant scrape as the tenant dashboard, and exists because the question is different rather than the data. A budget owner is asking what each tenant consumed and what it cost, which is one metric read across every namespace at once, not the health of any one of them.
The security dashboard splits the same way and reads all three scrapes, because the evidence a reviewer asks for is spread across them: egress is on the proxy scrape, the condition gauges and webhook counters on the GMC's, and the admission-policy verdicts on the apiserver's.
The screenshots below are rendered against a real Prometheus with synthetic data by the reproducible harness in
deploy/monitoring/preview/; regenerate them there whenever a dashboard changes.
Tenant dashboard¶
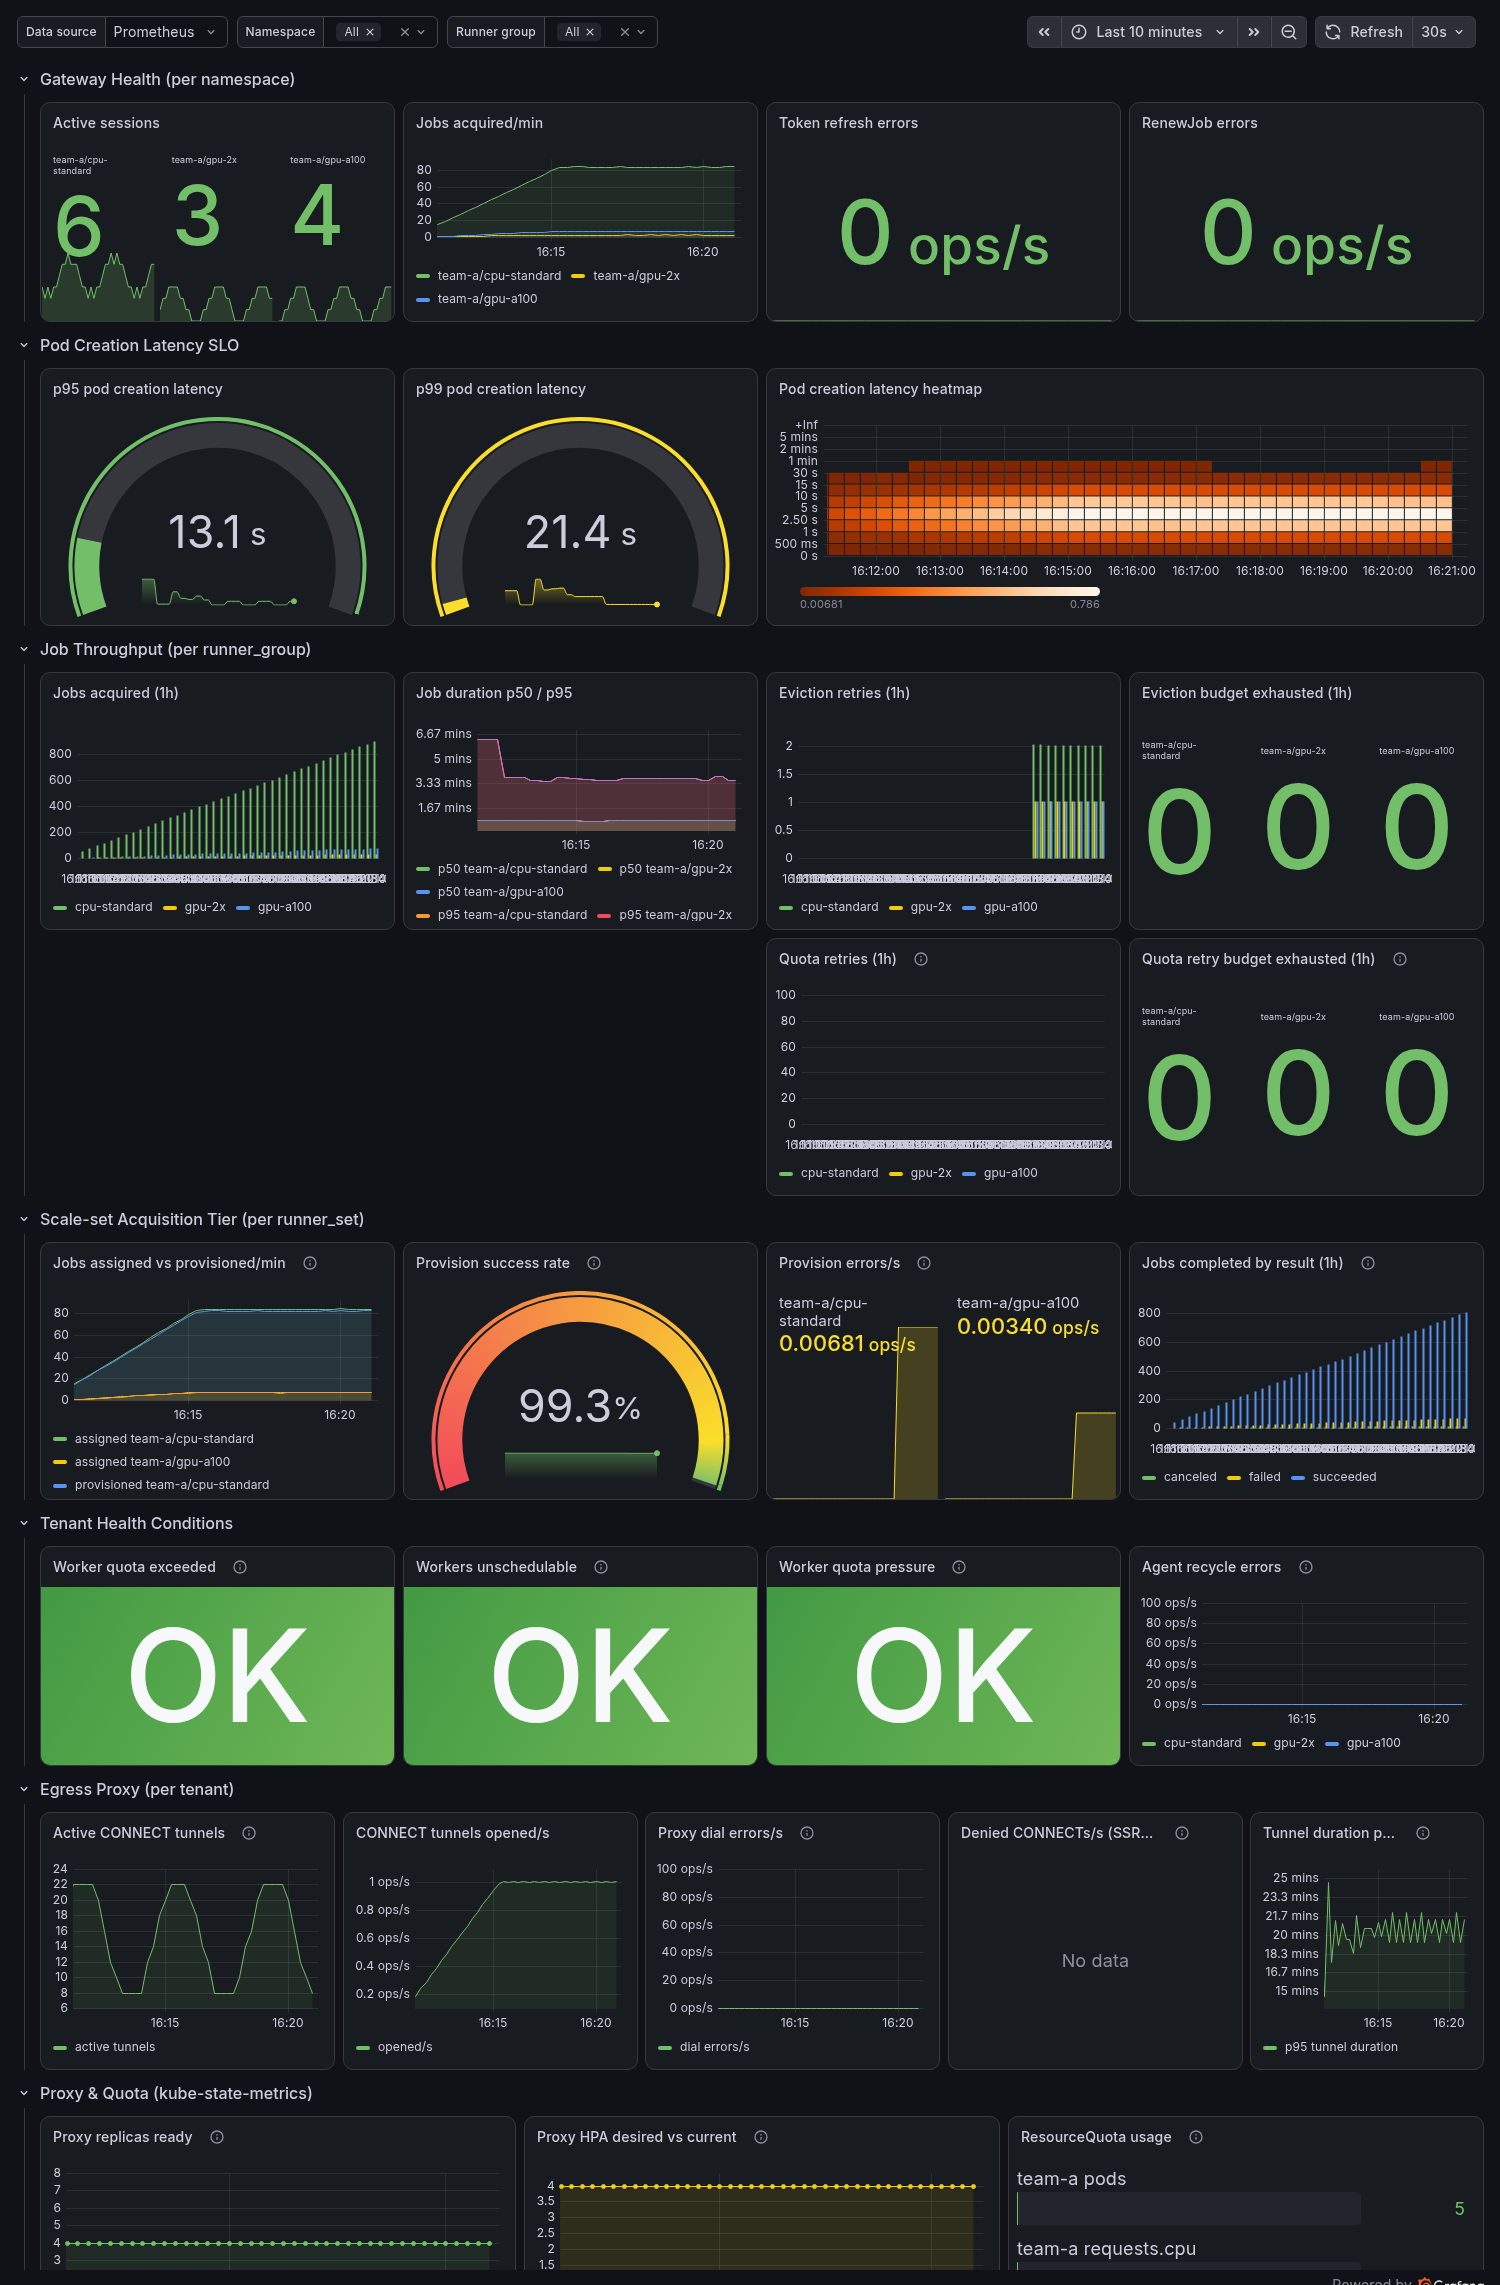
Filtered by the $namespace, $runner_group, and $runner_set template variables.
Uses the SLO recording rules as data sources where applicable.
Row 1 — Gateway Health (per namespace)
| Panel | Query | Visualization |
|---|---|---|
| Active sessions | actions_gateway_active_sessions |
Stat / Time series |
| Jobs acquired/min | rate(actions_gateway_jobs_acquired_total[5m]) * 60 |
Time series |
| Token refresh errors | rate(actions_gateway_token_refresh_errors_total[5m]) |
Stat (threshold: >0 = red) |
| RenewJob errors | rate(actions_gateway_renew_job_errors_total[5m]) |
Stat (threshold: >0 = yellow) |
Row 2 — Pod Creation Latency SLO
| Panel | Query | Visualization |
|---|---|---|
| p95 latency | actions_gateway:pod_creation_latency_seconds:p95 |
Gauge (green <15s, yellow <60s, red >60s) |
| p99 latency | actions_gateway:pod_creation_latency_seconds:p99 |
Gauge |
| Latency heatmap | rate(actions_gateway_pod_creation_latency_seconds_bucket[5m]) |
Heatmap |
Row 3 — Job Throughput (per runner_group)
| Panel | Query | Visualization |
|---|---|---|
| Jobs acquired total | increase(actions_gateway_jobs_acquired_total[1h]) |
Bar chart by runner_group |
| Job duration p50/p95 | actions_gateway:job_duration_seconds:p50/p95 |
Time series, both acquisition tiers. Worker pod lifetime, so it excludes the pre-creation staging a slow acquirejob or a spec.scaleUp throttle adds |
| AGC / proxy version | actions_gateway_build_info{component=~"agc\|proxy"} |
Stat showing the series name, not its value (the value is always 1). Sits under the job-duration panel because it says which span that panel is measuring: the classic tier's was longer before v1.5.0 and nothing was renamed (upgrade note). The metric carries no namespace label, so $namespace does not filter it |
| Disruption retries | sum by (runner_group, tier, cause) (increase(actions_gateway_eviction_retries_total[1h])) |
Bar chart, split by acquisition tier (classic, scaleset) and cause (eviction, preemption, deletion, abandoned, vanished). Keep the causes visually distinct: eviction rising means node pressure, preemption rising means a priorityTiers floor is displacing opportunistic work, abandoned rising means workers are not being scheduled at all before pendingPodDeadline reaps them, vanished rising means the AGC itself keeps missing worker teardowns — different investigations entirely |
| Abandoned runs awaiting capacity | sum by (runner_group, tier, outcome) (increase(actions_gateway_abandoned_run_rerun_waits_total[1h])) |
Stat or bar chart, split by acquisition tier since Q766 ported the recovery to scaleset. expired is the one to watch: a job whose run was force-cancelled and whose capacity never came back inside the wait window is a job silently lost until someone re-runs it by hand |
| Disruption budget exhausted | increase(actions_gateway_eviction_retries_exhausted_total[1h]) |
Stat (threshold: >0 = red) |
| Quota retries | increase(actions_gateway_quota_retries_total[1h]) |
Bar chart |
| Quota retry budget exhausted | increase(actions_gateway_quota_retries_exhausted_total[1h]) |
Stat (threshold: >0 = red) |
Row 4 — Scale-set Acquisition Tier (per runner_set)
The default acquisition protocol (Q264).
These panels are the scale-set analog of the classic Gateway-Health and Job-Throughput rows above: a ScaleSet-protocol RunnerSet never emits actions_gateway_active_sessions or jobs_acquired_total, so its throughput and health are only visible here.
Labelled by runner_set (not runner_group), so the $runner_group variable does not filter these; the $runner_set variable does.
| Panel | Query | Visualization |
|---|---|---|
| Jobs assigned vs. provisioned/min | sum by (namespace, runner_set) (rate(actions_gateway_scaleset_jobs_assigned_total[5m])) * 60 and the …_provisioned_total counterpart |
Time series (a persistent gap = provisioning lagging) |
| Provision success rate | actions_gateway:scaleset_provision_success_rate:rate5m |
Gauge (green >0.99, yellow <0.99, red <0.9) |
| Provision errors/s | sum by (namespace, runner_set) (rate(actions_gateway_scaleset_provision_errors_total[5m])) |
Stat (threshold: >0 = yellow) |
| Jobs completed by result (1h) | sum by (result) (increase(actions_gateway_scaleset_jobs_completed_total[1h])) |
Bar chart by result |
| Worker pods reaped/s (by reason) | sum by (namespace, runner_set, reason) (rate(actions_gateway_worker_pods_reaped_total{runner_set!=""}[5m])) |
Time series — the reaper counter's per-RunnerSet series (Q514), joinable with the capacity gauges above on (namespace, runner_set). The label keys on the owning kind, so a Classic-protocol RunnerSet appears here too |
Row 5 — Tenant Health Conditions
Panel titles here drop the Worker/Workers prefix the row header already supplies: six panels share the 24-column row, and a 4-wide panel ellipsis-truncates anything longer in the rendered screenshot.
| Panel | Query | Visualization |
|---|---|---|
| Quota exceeded | max(actions_gateway_worker_quota_exceeded or actions_gateway_runnerset_worker_quota_exceeded) |
Stat (1 = red) |
| Unschedulable | max(actions_gateway_workers_unschedulable or actions_gateway_runnerset_workers_unschedulable) |
Stat (1 = red) |
| Not starting | max(actions_gateway_runnerset_workers_not_starting) |
Stat (1 = red) |
| Quota pressure | max(actions_gateway_worker_quota_pressure or actions_gateway_runnerset_worker_quota_pressure) |
Stat (1 = yellow) |
| Capacity declined | max by (reason) (actions_gateway_runnerset_worker_capacity_declined) |
Stat (1 = orange), reason shown beside the value |
| Recycle errors | rate(actions_gateway_agent_recycle_errors_total[5m]) |
Time series |
The quota and unschedulable panels union the v1
RunnerGroupfamily with itsactions_gateway_runnerset_*v2 twin (Q319);Not startingandCapacity declinedare v2-only and have no v1 family to union. The two families key on different labels —runner_groupandrunner_set— soorunions rather than overlaps them, and a panel that named only the v1 family would read a flat0on a v2-only deploy. To break either out per owner, replacemax(...)withmax by (namespace, runner_set) (actions_gateway_runnerset_...).
Capacity declinedhas no v1 twin, andNo datais a normal reading (Q643, Q658). The gauge is emitted only for aRunnerSetthat setspec.capacityGate.mode, so an empty panel means no set opted in, not that the query is broken. It groups byreasonrather than reducing to a bare0/1because the value alone cannot separate a live decline from the latchedAwaitingProbestate, and those call for different actions; exactly one series exists per gated set, somax by (reason)cannot double-count. The1is orange rather than red on purpose: a latched gate is throttling intake, not failing, and it can sitTrueindefinitely on an idle set whose shape stays unplaceable.
Row 6 — Egress Proxy (per tenant)
| Panel | Query | Visualization |
|---|---|---|
| Active CONNECT tunnels | actions_gateway_proxy_connections_active |
Time series |
| CONNECT tunnels opened/s | rate(actions_gateway_proxy_connections_total[5m]) |
Time series |
| Proxy dial errors/s | rate(actions_gateway_proxy_dial_errors_total[5m]) |
Time series |
| Denied CONNECTs/s (SSRF signal) | rate(actions_gateway_proxy_connect_denied_total[5m]) |
Time series |
| Tunnel duration p95 | histogram_quantile(0.95, rate(actions_gateway_proxy_tunnel_duration_seconds_bucket[5m])) |
Time series |
Row 7 — Proxy & Quota (kube-state-metrics)
| Panel | Query | Visualization |
|---|---|---|
| Proxy replicas ready | kube_deployment_status_replicas_ready{deployment="actions-gateway-proxy"} |
Time series |
| HPA desired vs. current | kube_horizontalpodautoscaler_status_*_replicas |
Time series |
| ResourceQuota usage | kube_resourcequota{type="used"} filtered by namespace |
Bar gauge |
Row 8 — Reliability Signals (Q315)
| Panel | Query | Visualization |
|---|---|---|
| Job acquisition errors/s (by reason) | sum by (namespace, reason) (rate(actions_gateway_job_acquisition_errors_total[5m])) |
Time series |
| Message poll errors/s (by reason) | sum by (namespace, reason) (rate(actions_gateway_message_poll_errors_total[5m])) |
Time series |
| RenewJob teardowns/s (by reason) | sum by (namespace, reason) (rate(actions_gateway_renew_job_teardowns_total[5m])) |
Time series |
| Worker pods reaped/s (by reason) | sum by (runner_group, reason) (rate(actions_gateway_worker_pods_reaped_total[5m])) |
Time series |
| Broker token propagation retries/s | sum by (runner_group) (rate(actions_gateway_broker_token_propagation_retries_total[5m])) |
Time series |
Row 9 — Fan-out Safety (Q260 / Q266)
| Panel | Query | Visualization |
|---|---|---|
| Duplicate job deliveries/s | sum by (runner_group) (rate(actions_gateway_jobs_duplicate_delivery_total[5m])) |
Time series |
| Abandoned-delivery completions/s (by outcome) | sum by (runner_group, outcome) (rate(actions_gateway_abandoned_delivery_completions_total[5m])) |
Time series |
| Fan-out loser recycle deferred/s (by outcome) | sum by (runner_group, outcome) (rate(actions_gateway_fanout_loser_recycle_deferred_total[5m])) |
Time series |
Platform dashboard¶
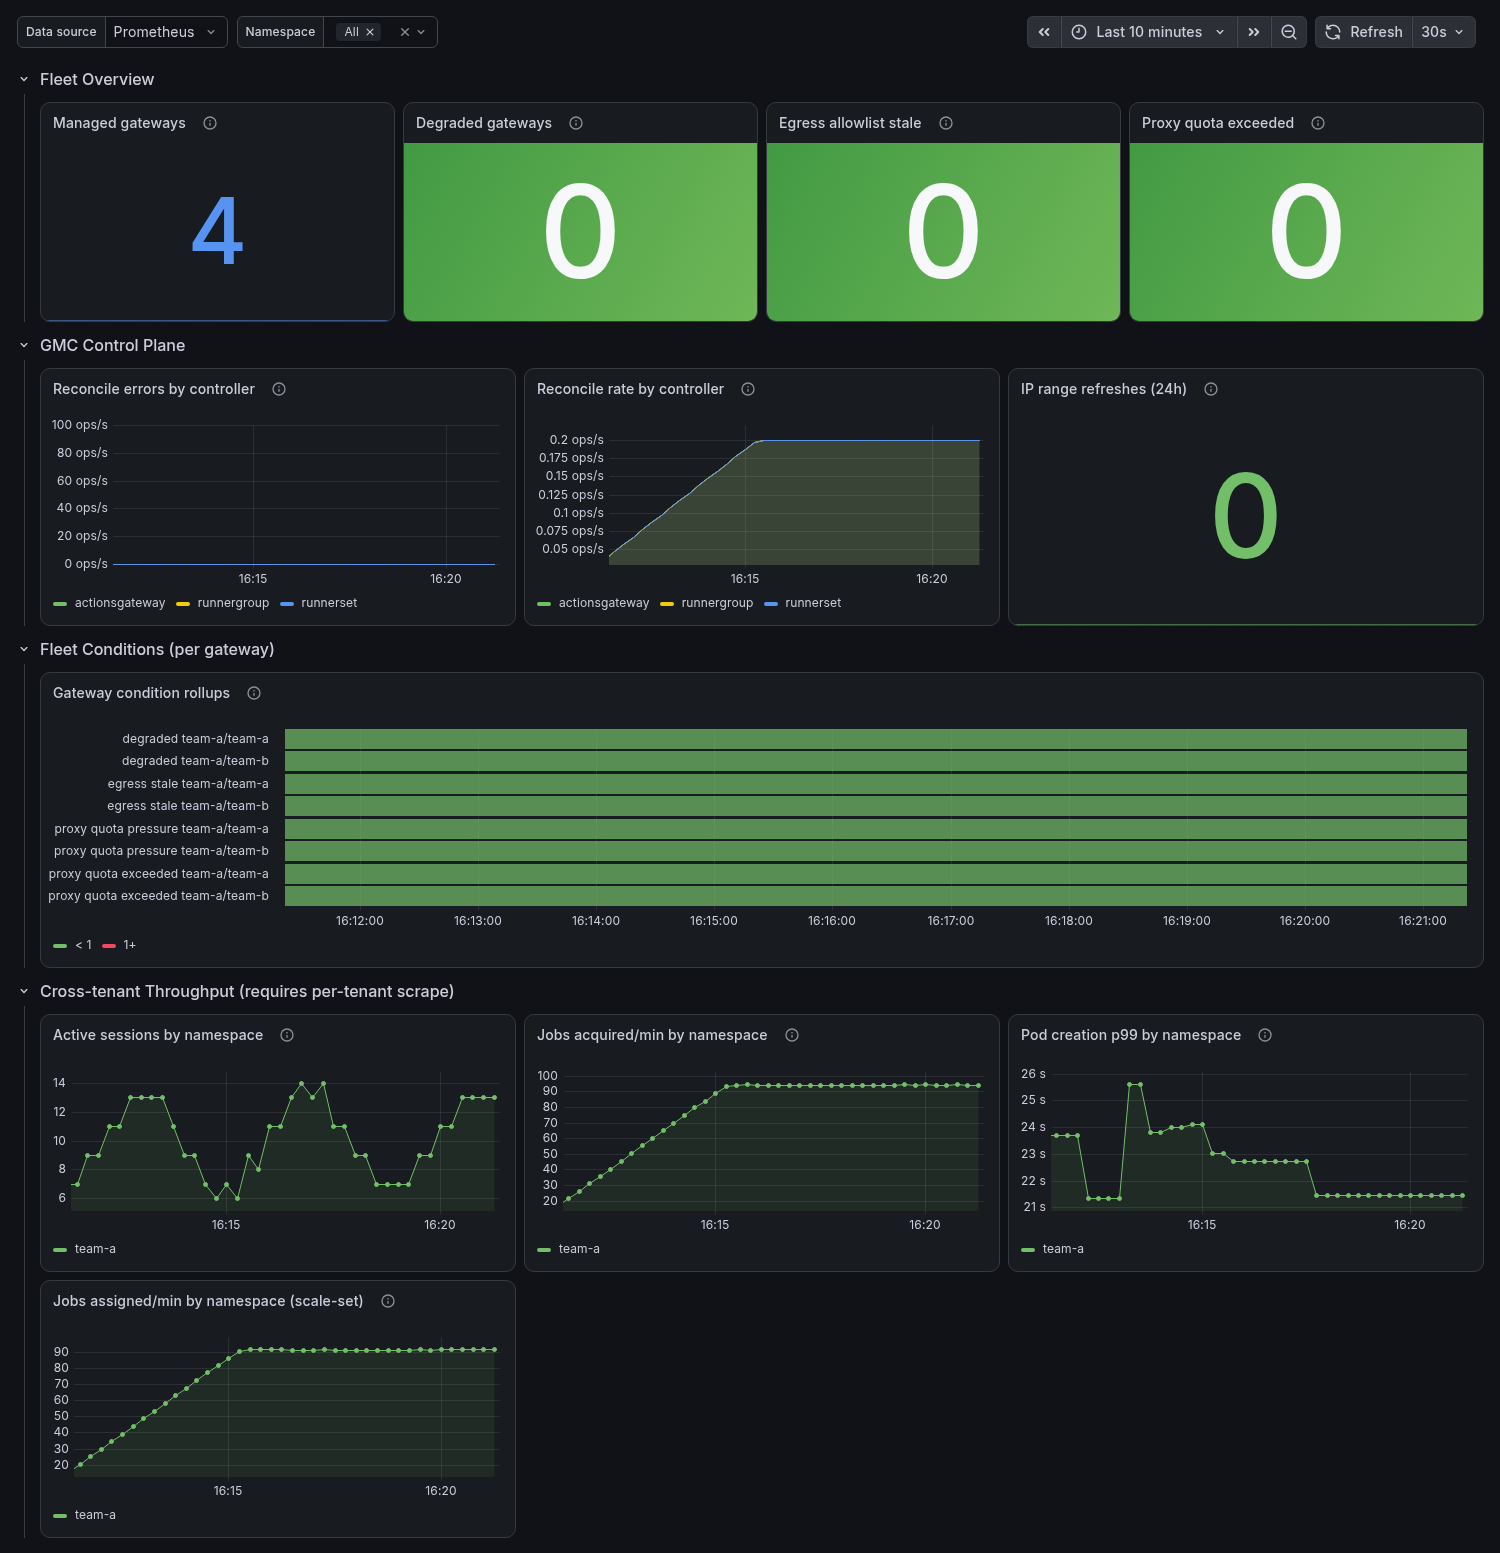
Fleet-wide; $namespace filters the cross-tenant rows.
Row 1 — Fleet Overview
| Panel | Query | Visualization |
|---|---|---|
| Managed gateways | actions_gateway_managed_gateways |
Stat |
| Degraded gateways | sum(actions_gateway_runnergroups_degraded) (v1) / sum(actions_gateway_runnersets_degraded) (v2) |
Stat (>0 = red) |
| Egress allowlist stale | sum(actions_gateway_egress_rules_stale) |
Stat (>0 = red) |
| Proxy quota exceeded | sum(actions_gateway_proxy_quota_exceeded) |
Stat (>0 = red) |
Row 2 — GMC Control Plane
| Panel | Query | Visualization |
|---|---|---|
| Reconcile errors by controller | rate(controller_runtime_reconcile_errors_total[5m]) |
Time series |
| Reconcile rate by controller | rate(controller_runtime_reconcile_total[5m]) |
Time series |
| IP range refreshes (24h) | sum(increase(actions_gateway_ip_range_updates_total[24h])) |
Stat |
Row 3 — Fleet Conditions (per gateway)
| Panel | Query | Visualization |
|---|---|---|
| Gateway condition rollups | actions_gateway_runnergroups_degraded / _egress_rules_stale / _proxy_quota_pressure / _proxy_quota_exceeded (v1); _runnersets_degraded / _agc_available / _egress_unattributed / _scale_set_name_collision (v2); _github_egress_incomplete (v2 EgressProxy only) |
State timeline (1 = firing) |
Row 4 — Cross-tenant Throughput (requires per-tenant scrape)
| Panel | Query | Visualization |
|---|---|---|
| Active sessions by namespace | sum by (namespace) (actions_gateway_active_sessions) |
Time series |
| Jobs acquired/min by namespace (classic) | sum by (namespace) (rate(actions_gateway_jobs_acquired_total[5m])) * 60 |
Time series |
| Pod creation p99 by namespace | actions_gateway:pod_creation_latency_seconds:p99 |
Time series, both acquisition tiers |
| Jobs assigned/min by namespace (scale-set) | sum by (namespace) (rate(actions_gateway_scaleset_jobs_assigned_total[5m])) * 60 |
Time series |
Row 5 — Build Versions
| Panel | Query | Visualization |
|---|---|---|
| Running versions by component | count by (component, version) (actions_gateway_build_info) |
Stat, one tile per component and version with the instance count |
The fleet's version spread during a staggered upgrade, and the answer to which tenants have crossed a semantics change: job_duration_seconds changed span at v1.5.0 without a rename (upgrade note).
The GMC comes from this dashboard's own scrape; agc and proxy need the per-tenant scrapes, so a platform-only Prometheus shows one bar.
actions_gateway_build_info carries no namespace label, so $namespace does not filter this row.
Budget dashboard¶
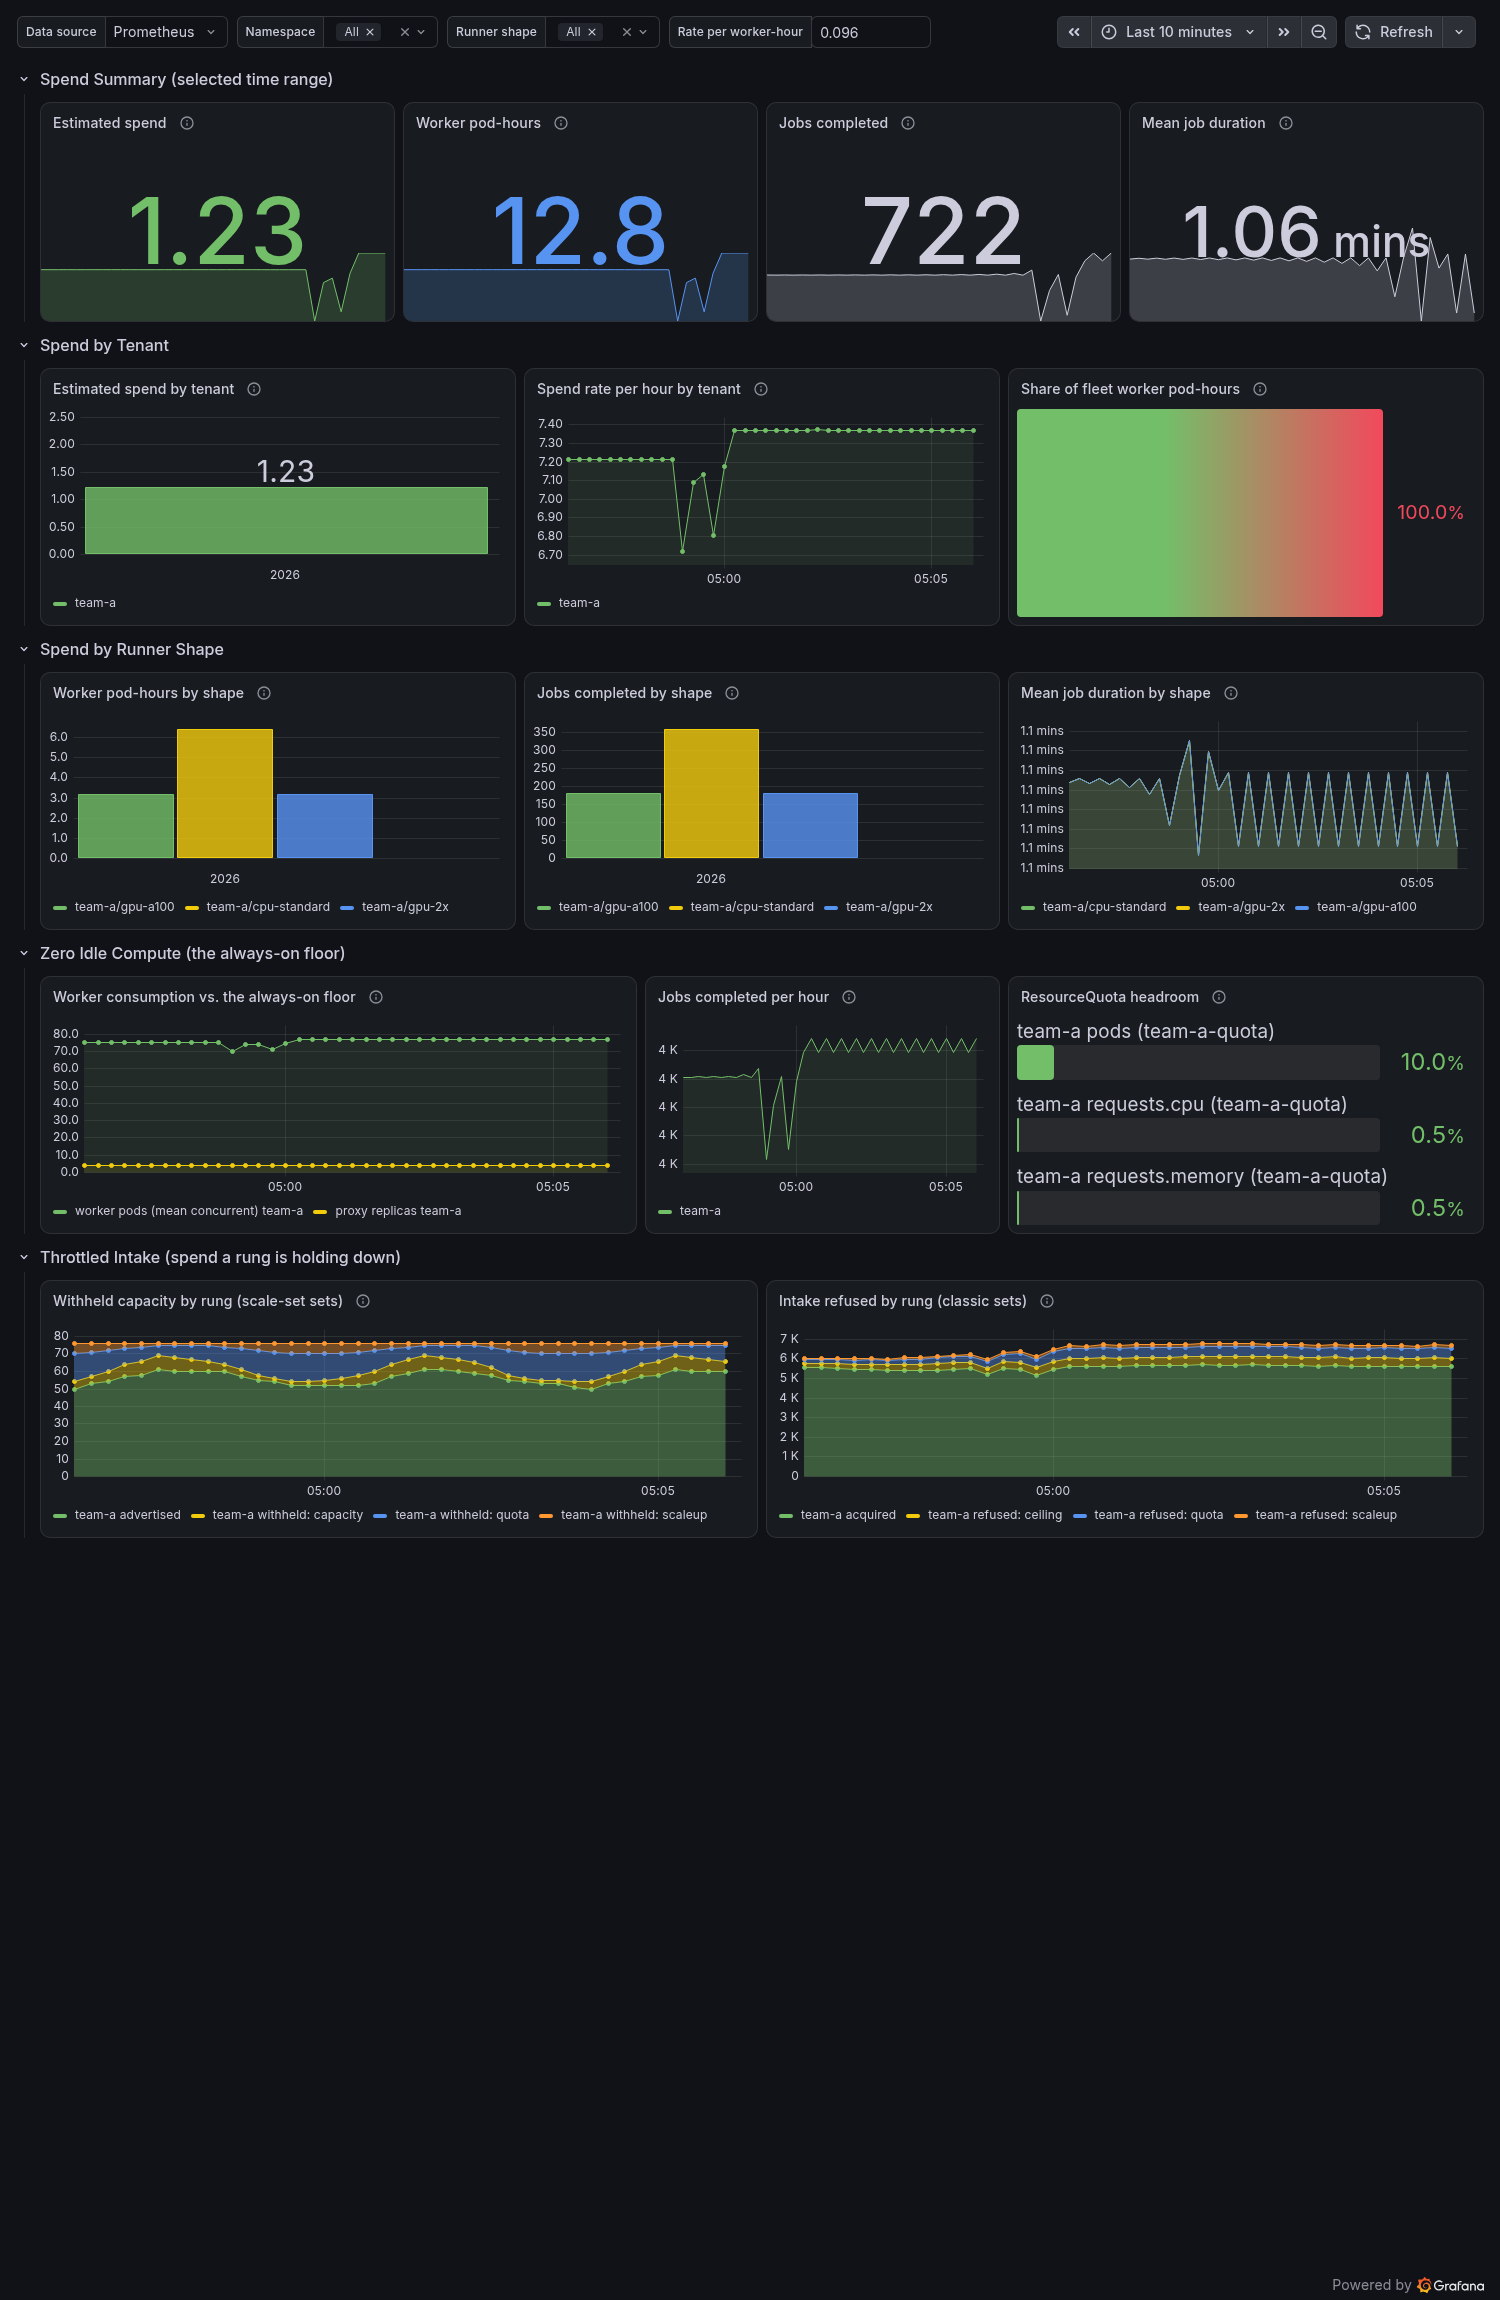
For the budget owner, who owns the spend and usually cannot read the cluster at all.
Filtered by $namespace and $runner_group, and priced by a $rate textbox.
It ships with auto-refresh off, where the other two use 30s: the default window is seven days, and a spend figure over that range does not change meaningfully between two thirty-second polls.
Every spend panel reads one metric: actions_gateway_job_duration_seconds.
That series is worker pod wall time (creation to the last container finishing) on both acquisition tiers, which is the span Appendix F §F.1 bills against.
A pod that never started a container is not observed, because it occupied no node time.
Row 5 is the exception, and reads the admission ladder instead: spend a throttle is holding down leaves no duration to bill, so the metric that answers what was spent cannot answer what was suppressed.
The rate is the operator's, not ours. Appendix F's formula is (job_duration_seconds / 3600) × hourly_node_rate × resource_fraction, and $rate is that trailing pair collapsed into one number: the effective hourly cost of one worker slot. The shipped default, 0.096, is §F.1's own CPU example: an m6i.4xlarge at $0.768/hr with the pod requesting an eighth of it.
Its GPU example works out at $4.10/hr, so the two differ by more than 40×.
That spread is why the shape-level panels stay in pod-hours: one currency figure spanning a tenant's GPU and CPU shapes is an average of two rates that are nothing like each other.
To read one shape's spend, pin $runner_group and set $rate to that shape's slot rate.
For per-tenant currency computed from a real node price book rather than a typed constant, use Cost attribution; this dashboard is the GAG-native cross-check for it, not a replacement.
Row 1 — Spend Summary (selected time range)
Every panel here uses $__range, so the time picker is the billing window: switch it to 30 days and the numbers are a month's.
| Panel | Query | Visualization |
|---|---|---|
| Estimated spend | sum(increase(actions_gateway_job_duration_seconds_sum[$__range])) / 3600 * $rate |
Stat. Currency only as far as $rate is right for the selection |
| Worker pod-hours | sum(increase(actions_gateway_job_duration_seconds_sum[$__range])) / 3600 |
Stat, the measured quantity with no rate applied. This is the number to reconcile against a cost tool's own pod-hours |
| Jobs completed | sum(increase(actions_gateway_job_duration_seconds_count[$__range])) |
Stat |
| Mean job duration | pod-hours ÷ jobs | Stat. No data when the range holds no completed job, since the divisor is zero |
Row 2 — Spend by Tenant
The comparison panels run instant queries, which is where this dashboard departs from its two neighbours. They are both panels in this row, both bar charts in Row 3, and the bar gauge in Row 4: each reduces the whole range to one number per tenant or per resource, so a range query would plot one bar per scrape and the comparison the panel exists to make would be unreadable. The time-series panels stay range queries, because a trend is what they are for.
| Panel | Query | Visualization |
|---|---|---|
| Estimated spend by tenant | sum by (namespace) (increase(actions_gateway_job_duration_seconds_sum[$__range])) / 3600 * $rate |
Bar chart, instant. Namespace is tenant, which is why this lines up with an aggregate=namespace allocation report with no extra wiring |
| Spend rate per hour by tenant | sum by (namespace) (rate(actions_gateway_job_duration_seconds_sum[5m])) * $rate |
Time series. Pod-seconds per second is pod-hours per hour, so this is a live burn rate. The histogram attributes a pod's whole lifetime at completion, so the series is a trailing average and is lumpy over windows near the job duration itself |
| Share of fleet worker pod-hours | tenant pod-hours ÷ scalar(...) of the unfiltered total |
Bar gauge, percent. The denominator is deliberately unfiltered, so filtering to one tenant shows its share of everything rather than 100% of itself. Rate-free |
Row 3 — Spend by Runner Shape
Split by runner_group, which on the scale-set tier carries the RunnerSet name rather than a RunnerGroup one: the pod-side reading takes whichever owner label the pod carries, so one label key covers both tiers (Q713).
A shape here is therefore whatever provisioned the worker, on either protocol.
| Panel | Query | Visualization |
|---|---|---|
| Worker pod-hours by shape | sum by (namespace, runner_group) (increase(actions_gateway_job_duration_seconds_sum[$__range])) / 3600 |
Bar chart, instant. Hours rather than currency, per the rate spread above |
| Jobs completed by shape | the …_count counterpart |
Bar chart, instant. Beside the pod-hours bars it separates the two ways a shape's spend grows: more jobs, or slower jobs |
| Mean job duration by shape | rate(…_sum[5m]) / rate(…_count[5m]), both sum by (namespace, runner_group) |
Time series. A shape drifting upward buys less for the same money; a large divergence from a cost tool's pod-hours for that shape usually means oversized resource requests (right-sizing) |
Row 4 — Zero Idle Compute (the always-on floor)
The row that answers "what am I paying for when nobody is running CI?".
| Panel | Query | Visualization |
|---|---|---|
| Worker consumption vs. the always-on floor | sum by (namespace) (rate(actions_gateway_job_duration_seconds_sum[5m])) against kube_deployment_status_replicas_ready{deployment="actions-gateway-proxy"} |
Time series, two series on one panel deliberately. Over a quiet weekend the worker line collapses toward zero while the proxy line stays flat, and that flat line is the entire idle floor. An Actions Runner Controller (ARC) scale set holding minRunners > 0 would show a worker line that never reaches zero. The worker series comes from the duration histogram, which attributes a pod's whole lifetime at completion, so it is a trailing average over the rate window rather than a live pod count: it will not equal the pod count behind the quota panel beside it. Needs kube-state-metrics |
| Jobs completed per hour | sum by (namespace) (rate(actions_gateway_job_duration_seconds_count[5m])) * 3600 |
Time series showing the volume that drives the worker line beside it |
| ResourceQuota headroom | 100 * kube_resourcequota{type="used"} / ignoring(type) kube_resourcequota{type="hard"} |
Bar gauge, percent, one bar per quota object and resource. A tenant sitting near 100% is one whose spend is held down by the cap rather than by demand, which is a budget conversation rather than an incident. The join is ignoring(type) rather than on(namespace, resource), which errors on a namespace holding two ResourceQuota objects; it also keeps the resourcequota label, which is why the legend names it. A quota lowered below current usage makes the query return above 100%, measured at 200% on two pods under a one-pod quota; max is 100, so the bar cannot extend past full. Needs kube-state-metrics |
Row 5 — Throttled Intake (spend a rung is holding down)
Rows 1 to 4 answer what was spent.
This one answers what was not: intake an admission rung refused, which shows up nowhere in job_duration_seconds because a job that never ran has no duration to bill.
It is two panels rather than one because the two acquisition tiers state the same ladder in different units. The scale-set tier declares a capacity integer per long poll, so its rungs are gauges of worker slots; the classic tier decides per delivered job, so its rungs are counters of jobs. Both panels are stacked, and in both the stack total is the demand that tier saw, which is the reading they share. Their magnitudes are not comparable and neither panel is a total of the other. A deploy running one tier sees the other panel empty; that is the panel saying "no sets on this protocol", not a gap.
| Panel | Query | Visualization |
|---|---|---|
| Withheld capacity by rung (scale-set sets) | sum by (namespace) (actions_gateway_scaleset_advertised_capacity) stacked under sum by (namespace, reason) (actions_gateway_scaleset_capacity_withheld) |
Time series, stacked. The stack total is the set's declared worker ceiling, because every evaluated rung publishes a value each poll including an explicit 0 and the entries sum to ceiling − advertised. quota is namespace-ResourceQuota headroom, capacity the opt-in placeability gate, scaleup the opt-in creation-rate limit; grouping by reason rather than naming the three means a rung added later arrives as a new band with no edit here. Filtered on runner_set, so a $runner_group holding a RunnerGroup name empties it |
| Intake refused by rung (classic sets) | sum by (namespace) (rate(actions_gateway_jobs_acquired_total[5m])) * 3600 stacked under the actions_gateway_jobs_admission_rejected_total counterpart, sum by (namespace, reason) |
Time series, stacked, jobs/hour. The stack is what GitHub delivered, less the deliveries lost to an acquire error (actions_gateway_job_acquisition_errors_total) or a duplicate-delivery dedup, which increment neither series. ceiling and quota are on by default; capacity and scaleup emit nothing until their owner opts in, so an absent band is a rung nobody enabled rather than a rung holding nothing back |
Withheld capacity is not the same thing as suppressed spend, which is why no panel here prices it with $rate. A slot a rung held back is money you did not spend only if GitHub had a job queued to fill it; on an idle set the same band is a ceiling nobody was reaching for.
The demand signal that settles it is actions_gateway_scaleset_jobs_available, which no dashboard plots today.
A currency figure derived without it would overstate the suppression, on a dashboard whose whole contract is that its numbers reconcile against a cost tool's.
Read against the ResourceQuota bars beside it, the quota band is the same conversation from the other side: the bar says a tenant is pinned at its cap, and this band says how many worker slots that cost it.
Security dashboard¶
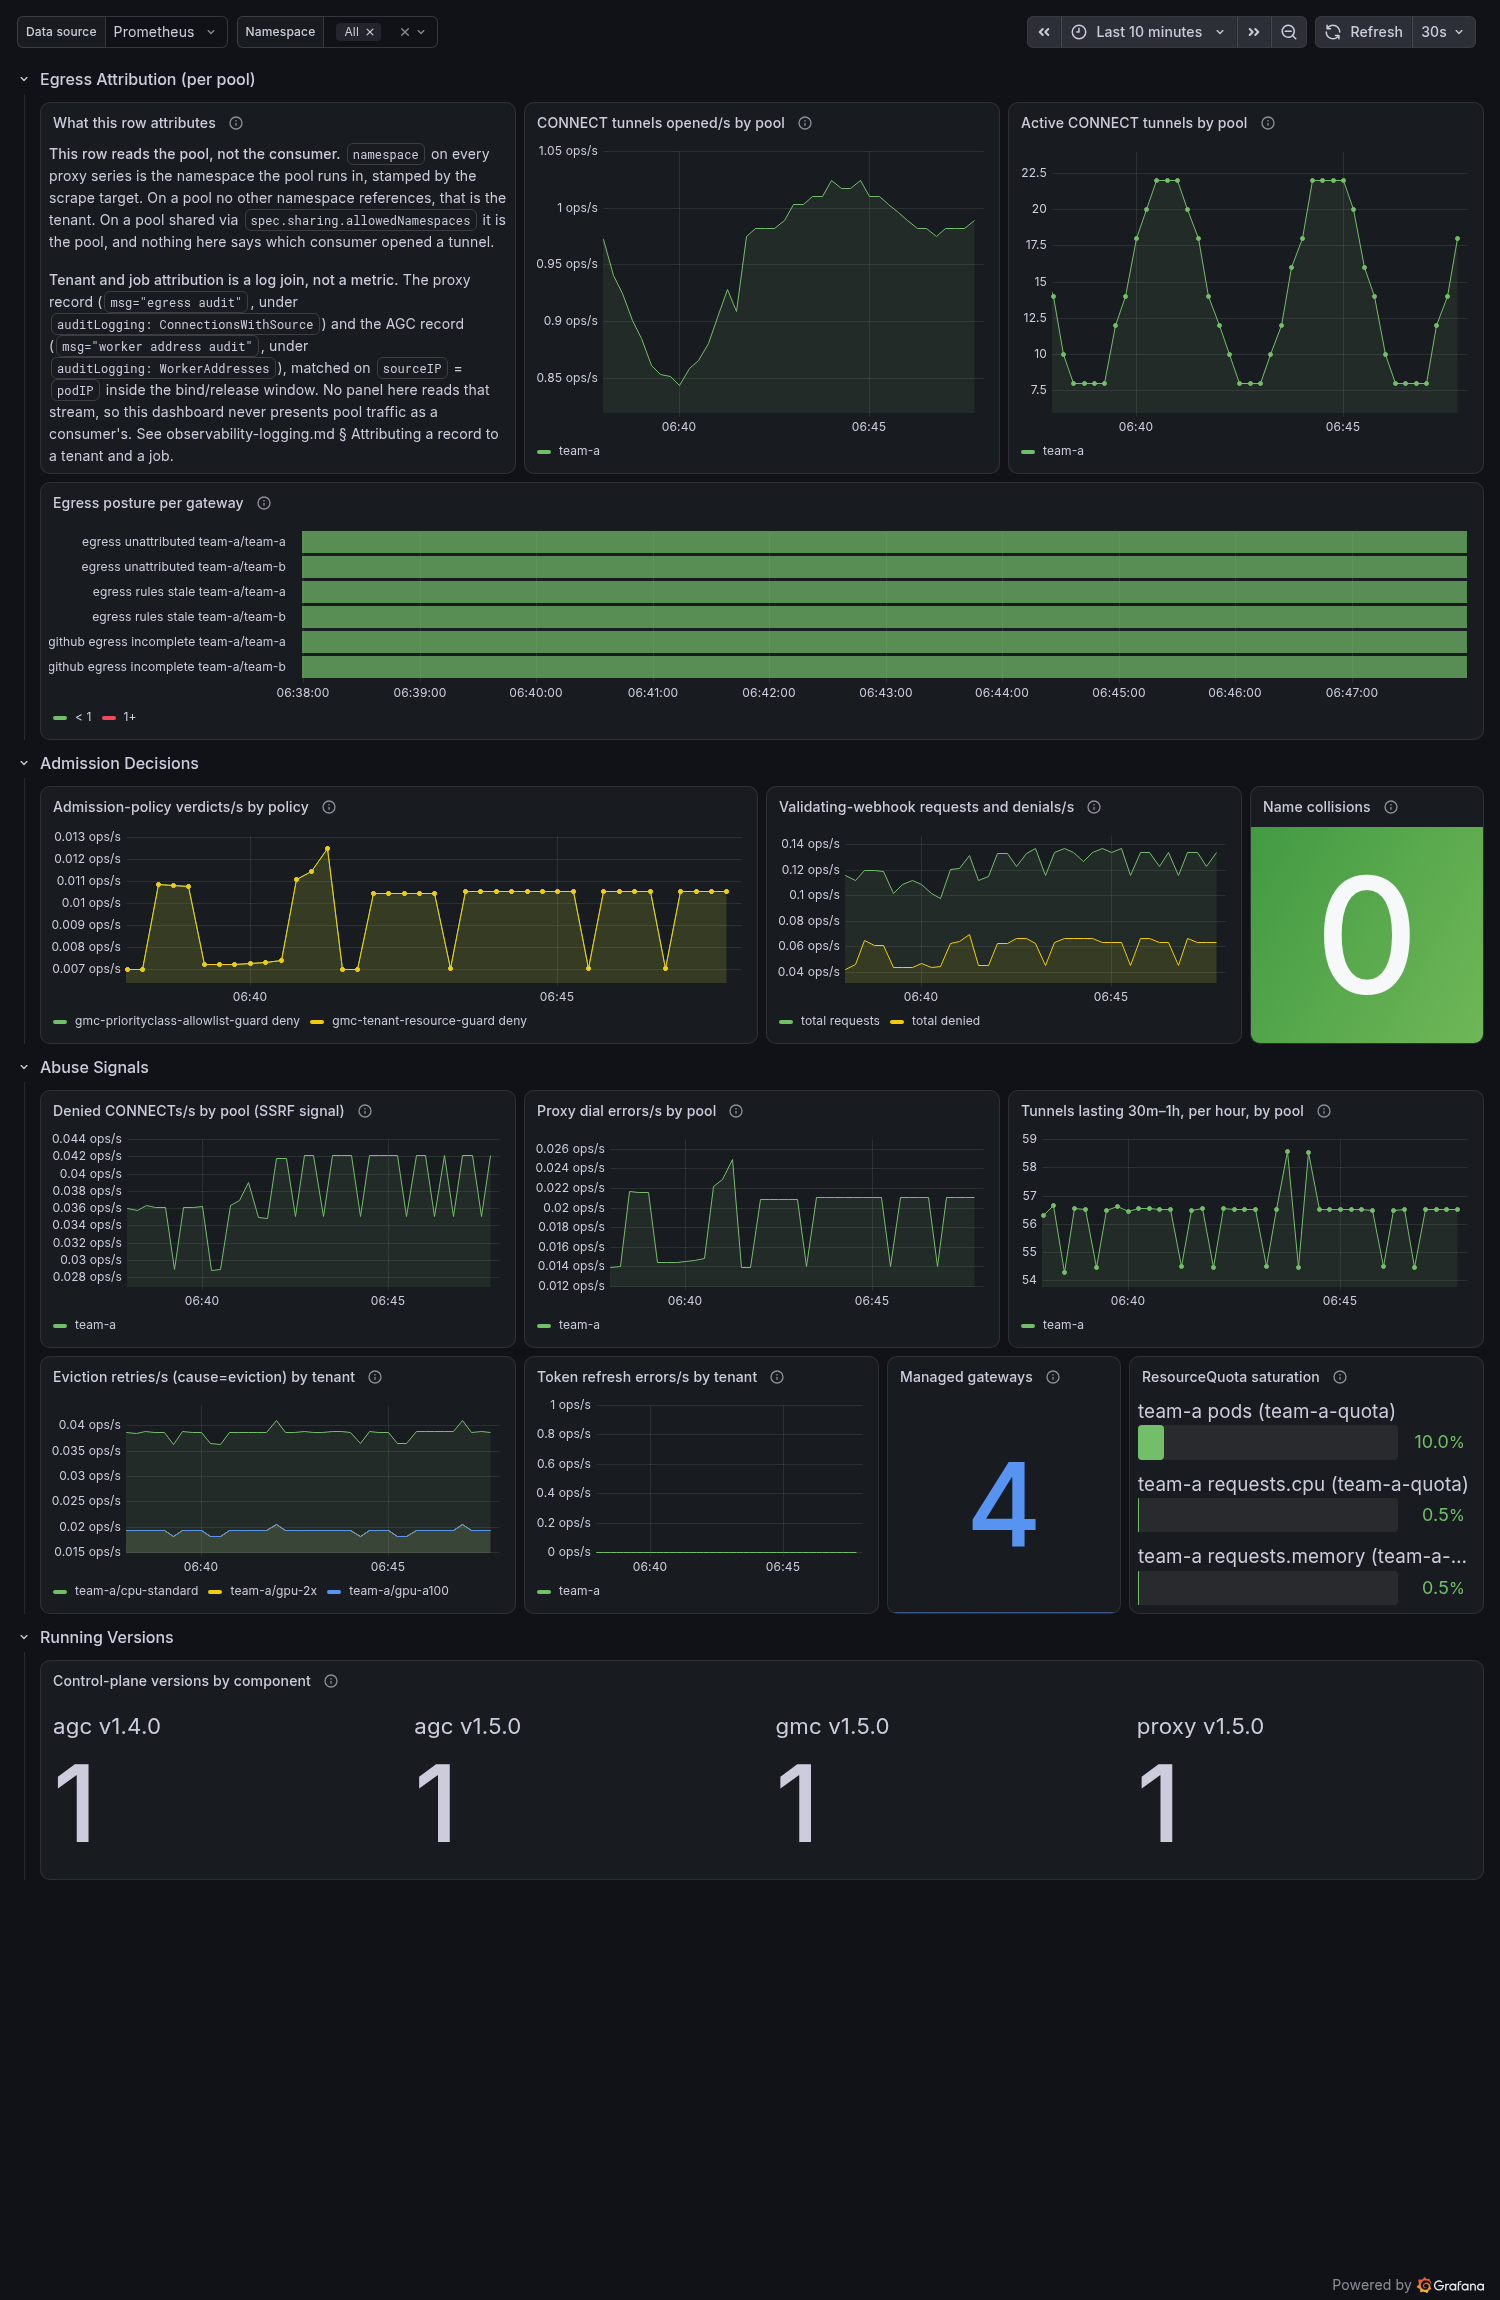
For the security / compliance persona, who reads rather than operates and needs evidence produced unprompted.
Filtered by $namespace.
It reads three scrapes, and each row says which: egress and the abuse counters come from the per-tenant proxy and AGC scrapes, the condition gauges and webhook counters from the GMC scrape, and the admission-policy verdicts from the apiserver scrape, which kube-prometheus-stack collects by default and a hand-built Prometheus may not.
It is keyed on the pool, not the consumer, and says so on the page. namespace on every proxy series is the namespace the pool runs in, stamped by the scrape target.
On a pool no other namespace references that is the tenant; on a pool shared via spec.sharing.allowedNamespaces it is the pool, and no metric says which consumer opened a tunnel.
Attributing a connection to a tenant and a job is the audit-record join of two log streams, and no panel here reads them, so the dashboard never presents a pool's traffic as a consumer's.
Whether that join is missing for a gateway is now a gauge, actions_gateway_egress_audit_unattributed, 1 while either half of the pair is off (Q1062), and that is the series a consumer-keyed panel would have to gate on.
No panel here reads it yet (Q1070).
It reads the gateway's defaultProxyRef only, so it is not a per-pool answer: a RunnerSet naming its own spec.proxyRef egresses through a pool the gauge never looked at, in both directions (Q1069).
A panel keyed on it is therefore gating on the gateway's declared pair, not on the pool whose traffic it would be drawing.
Row 1: Egress Attribution (per pool)
| Panel | Query | Visualization |
|---|---|---|
| What this row attributes | none | Text. The pool-versus-consumer reading above, stated where the panels are read |
| CONNECT tunnels opened/s by pool | sum by (namespace) (rate(actions_gateway_proxy_connections_total[5m])) |
Time series, one line per pool namespace |
| Active CONNECT tunnels by pool | sum by (namespace) (actions_gateway_proxy_connections_active) |
Time series. A pool pinned near capacity is the slowloris signal (ActionsGatewayProxyConnectionsSaturated) |
| Egress posture per gateway | actions_gateway_egress_unattributed / _egress_rules_stale / _github_egress_incomplete |
State timeline (1 = flagged). Whether a tenant's egress is attributable at all: direct mode leaves from no per-tenant proxy, a stale allowlist may have drifted from GitHub's ranges, and an incomplete GHES allowlist denies the appliance. GMC scrape; egress_rules_stale is emitted for v1 and v2 gateways, the other two for v2 only |
actions_gateway_egress_audit_unattributed belongs in that timeline as a fourth flag and is not in it yet (Q1070).
It shares the row's 1 = flagged polarity, and it is the job-attribution half, whether an egress record resolves to a tenant and a job, where egress_unattributed is the IP-identity half, whether there is a per-tenant proxy at all.
A gateway can be proxied and still unattributed by job, and that is the common state, since both halves of the pair default Off.
Expect it near-solid 1 across a fleet that has not opted in, which is a true reading rather than an incident: unlike its three neighbours, a 1 here is a tenant nobody turned attribution on for, not something that broke.
Row 2: Admission Decisions
| Panel | Query | Visualization |
|---|---|---|
| Admission-policy verdicts/s by policy | sum by (policy, enforcement_action) (rate(apiserver_validating_admission_policy_check_total{policy=~".*-(namespace-psa-guard\|namespace-security-profile-guard\|priorityclass-allowlist-guard\|tenant-resource-guard)"}[5m])) |
Time series, split by the action the binding took: deny rejected the write, audit and warn let a failed validation through, and allow is an evaluation error (error_type of compile_error, invalid_error, or out_of_budget) admitted under failurePolicy: Ignore. The apiserver never increments the counter for a validation that simply passed, so the series is what the policies refused or could not evaluate, not a request count. Values read from kubernetes/kubernetes at release-1.36 on 2026-09-07. The policy name is matched on its suffix because the chart prefixes it with the release's namePrefix. Apiserver scrape |
| Validating-webhook requests and denials/s | sum (rate(controller_runtime_webhook_requests_total{webhook=~"/validate-.*"}[5m])) and sum (rate(apiserver_admission_webhook_rejection_count{name=~"v(actionsgateway-v1alpha1\|actionsgateway-v2alpha1\|clusterrunnertemplate-v2alpha1\|egressproxy-v2alpha1\|runnerset-v2alpha1\|runnertemplate-v2alpha1)\\.kb\\.io", error_type="no_error", rejection_code="403"}[5m])) |
Time series, two series: total requests and total denied. Both are summed across the six validating webhooks the chart ships rather than broken down: a per-webhook split overflows the cell's legend, and the ActionsGatewayWebhookRejections alert carries the offending webhook in its name label, so the breakdown is available where an operator acts on it. The GMC scrape says only that the webhooks are being exercised: controller-runtime writes a denial as an HTTP 200 whose AdmissionReview body carries the 403, so its code label cannot separate a deny from an allow. The apiserver reads that body, so its rejection counter is the series that answers how often a webhook refused (ActionsGatewayWebhookRejections), scoped to error_type="no_error" (the webhook reached and refusing, not the GMC unreachable under failurePolicy: Fail) and to the 403 a validator's denial produces, as against the 400 of a malformed AdmissionReview. Apiserver scrape. Label semantics read from kubernetes/kubernetes at release-1.36 on 2026-09-07; the metric is ALPHA-stability |
| Name collisions | sum(actions_gateway_scale_set_name_collision) |
Stat (≥1 = red), scale-set name collisions; the title drops the prefix because a 4-wide stat truncates it. Admission rejects every new pair, so a 1 predates the guard or was applied with the webhook uninstalled |
Row 3: Abuse Signals
One panel per rule in the security alert group not already plotted above (the saturation rule is the active-tunnels panel in Row 1, the webhook rule is Row 2), so a reviewer sees the series an alert would fire on rather than only the alert.
| Panel | Query | Visualization |
|---|---|---|
| Denied CONNECTs/s by pool (SSRF signal) | sum by (namespace) (rate(actions_gateway_proxy_connect_denied_total[5m])) |
Time series. Every increment is an explicit allowlist denial (ActionsGatewayProxyConnectDenied). It says a probe happened, not what it reached |
| Proxy dial errors/s by pool | sum by (namespace) (rate(actions_gateway_proxy_dial_errors_total[5m])) |
Time series (ActionsGatewayProxyDialErrorSpike) |
| Tunnels lasting 30m–1h, per hour, by pool | sum by (namespace) (increase(…_bucket{le="3600"}[1h])) - sum by (namespace) (increase(…_bucket{le="1800"}[1h])) |
Time series (ActionsGatewayProxyLongLivedTunnels). Each bucket is summed per namespace before the subtraction because the two selectors differ on le and a bare subtraction would match nothing |
| Eviction retries/s (cause=eviction) by tenant | sum by (namespace, runner_group) (rate(actions_gateway_eviction_retries_total{cause="eviction"}[15m])) |
Time series (ActionsGatewayEvictionRetryAbuse). Scoped to cause="eviction": preemption recoveries are the expected steady state under a preempting priorityTiers floor |
| Token refresh errors/s by tenant | sum by (namespace) (rate(actions_gateway_token_refresh_errors_total[5m])) |
Time series (ActionsGatewayTokenRefreshAbuse). Flat zero is healthy |
| Managed gateways | actions_gateway_managed_gateways |
Stat with trend (ActionsGatewayManagedGatewaysJump). No namespace label, so $namespace does not filter it |
| ResourceQuota saturation | 100 * kube_resourcequota{type="used"} / ignoring(type) kube_resourcequota{type="hard"} |
Bar gauge, percent, instant (ActionsGatewayQuotaExhausted). Needs kube-state-metrics |
Row 4: Running Versions
| Panel | Query | Visualization |
|---|---|---|
| Control-plane versions by component | count by (component, version) (actions_gateway_build_info) |
Stat, one tile per component and version: which build is running when an advisory names an affected version. No namespace label |
Dashboard Variables¶
The dashboards ship with these template variables already wired:
$namespace(label_values({__name__=~"actions_gateway_active_sessions|actions_gateway_scaleset_jobs_assigned_total"}, namespace)) filters to a single tenant, on the tenant and platform dashboards. The union of the classic and scale-set series is deliberate: a scale-set-only deploy emits noactive_sessions, so keying the variable on that alone would leave the dashboard blank.$runner_group(label_values(actions_gateway_active_sessions{namespace="$namespace"}, runner_group)) filters to a specific RunnerGroup on the classic-tier panels of the tenant dashboard. Therunner_set-labelled panels are not filtered by it;$runner_setis their variable.$runner_set(label_values(actions_gateway_runnerset_worker_quota_pressure{namespace="$namespace"}, runner_set)) filters to a specificRunnerSeton the scale-set and v2 capacity panels of the tenant dashboard. It reads its label values from the Q319 capacity gauges rather than thescaleset_*series on purpose: those gauges are emitted for everyRunnerSet, whilescaleset_*exists only forScaleSet-protocol sets, so keying on the latter would hide aClassicset from the dropdown entirely.
The budget dashboard declares its own set, because its spend panels all read one metric and its dropdowns have to match that metric exactly:
$namespace(label_values(actions_gateway_job_duration_seconds_count, namespace)) is keyed on the series the panels actually read, so the dropdown cannot offer a tenant with no cost data or hide one that has some. It needs no classic/scale-set union: the duration series is emitted from the pod informer and covers both tiers already.$runner_group(label_values(actions_gateway_job_duration_seconds_count{namespace=~"$namespace"}, runner_group)) is the runner shape, listingRunnerGroupandRunnerSetnames together for the reason the Row 3 note gives. Row 5's scale-set panel applies it torunner_set, which holds the same names on that tier, so selecting aRunnerGroupempties that panel and selecting aRunnerSetempties the classic one beside it.- Both dropdowns set
allValueto.*, which is what makes Row 5 legible on the tenant it exists for. Grafana expands a bareAllto the values the dropdown holds, and both are keyed on the duration series, so a tenant whose intake a rung is holding at zero has completed no job, is in neither list, and would be excluded byAllitself. The wildcard costs the spend panels nothing: a tenant with no duration data contributes no series to them either way. $rateis a textbox, not a query: the effective hourly cost of one worker slot, which is a fact about your contract and not something the cluster knows. Only the currency panels read it, so leaving the default in place still leaves every pod-hour and job count correct.
The security dashboard declares only $namespace (label_values({__name__=~"actions_gateway_proxy_connections_total|actions_gateway_active_sessions|actions_gateway_scaleset_jobs_assigned_total"}, namespace)), unioned across the proxy and both acquisition tiers so a namespace holding only a pool, or only a scale-set deploy, still appears.
On the proxy panels the value it filters is the pool's namespace, per the note at the top of that section.
A textbox variable in a panel query needs the PromQL gate to know about it.
make promql-checkparses every panel expression, and a Grafana variable in syntactic position ([$__range],* $rate) is not valid PromQL. The checker substitutes from the dashboard's owntemplating.listbefore parsing, so a variable the dashboard never declares is reported by name rather than passing as a parse error nobody reads.
← Back to Observability